
Understanding the business goal.
As healthcare organizations across the United States and Canada adopted the platform to access patient data and clinical workflows within ecosystems connected to thousands of healthcare institutions across North America, we focused on understanding how clinicians interacted with fragmented patient information in real-world scenarios.
The goal was to improve usability, reduce cognitive load, and enable scalable adoption across complex healthcare environments.
Objectives
Identify real usage and behavioral patterns among clinical professionals.
Reduce friction when navigating fragmented clinical data.
Improve clarity and speed across critical healthcare workflows.
Enable scalable adoption across clinics, laboratories, and hospitals.
Insight & Pain point
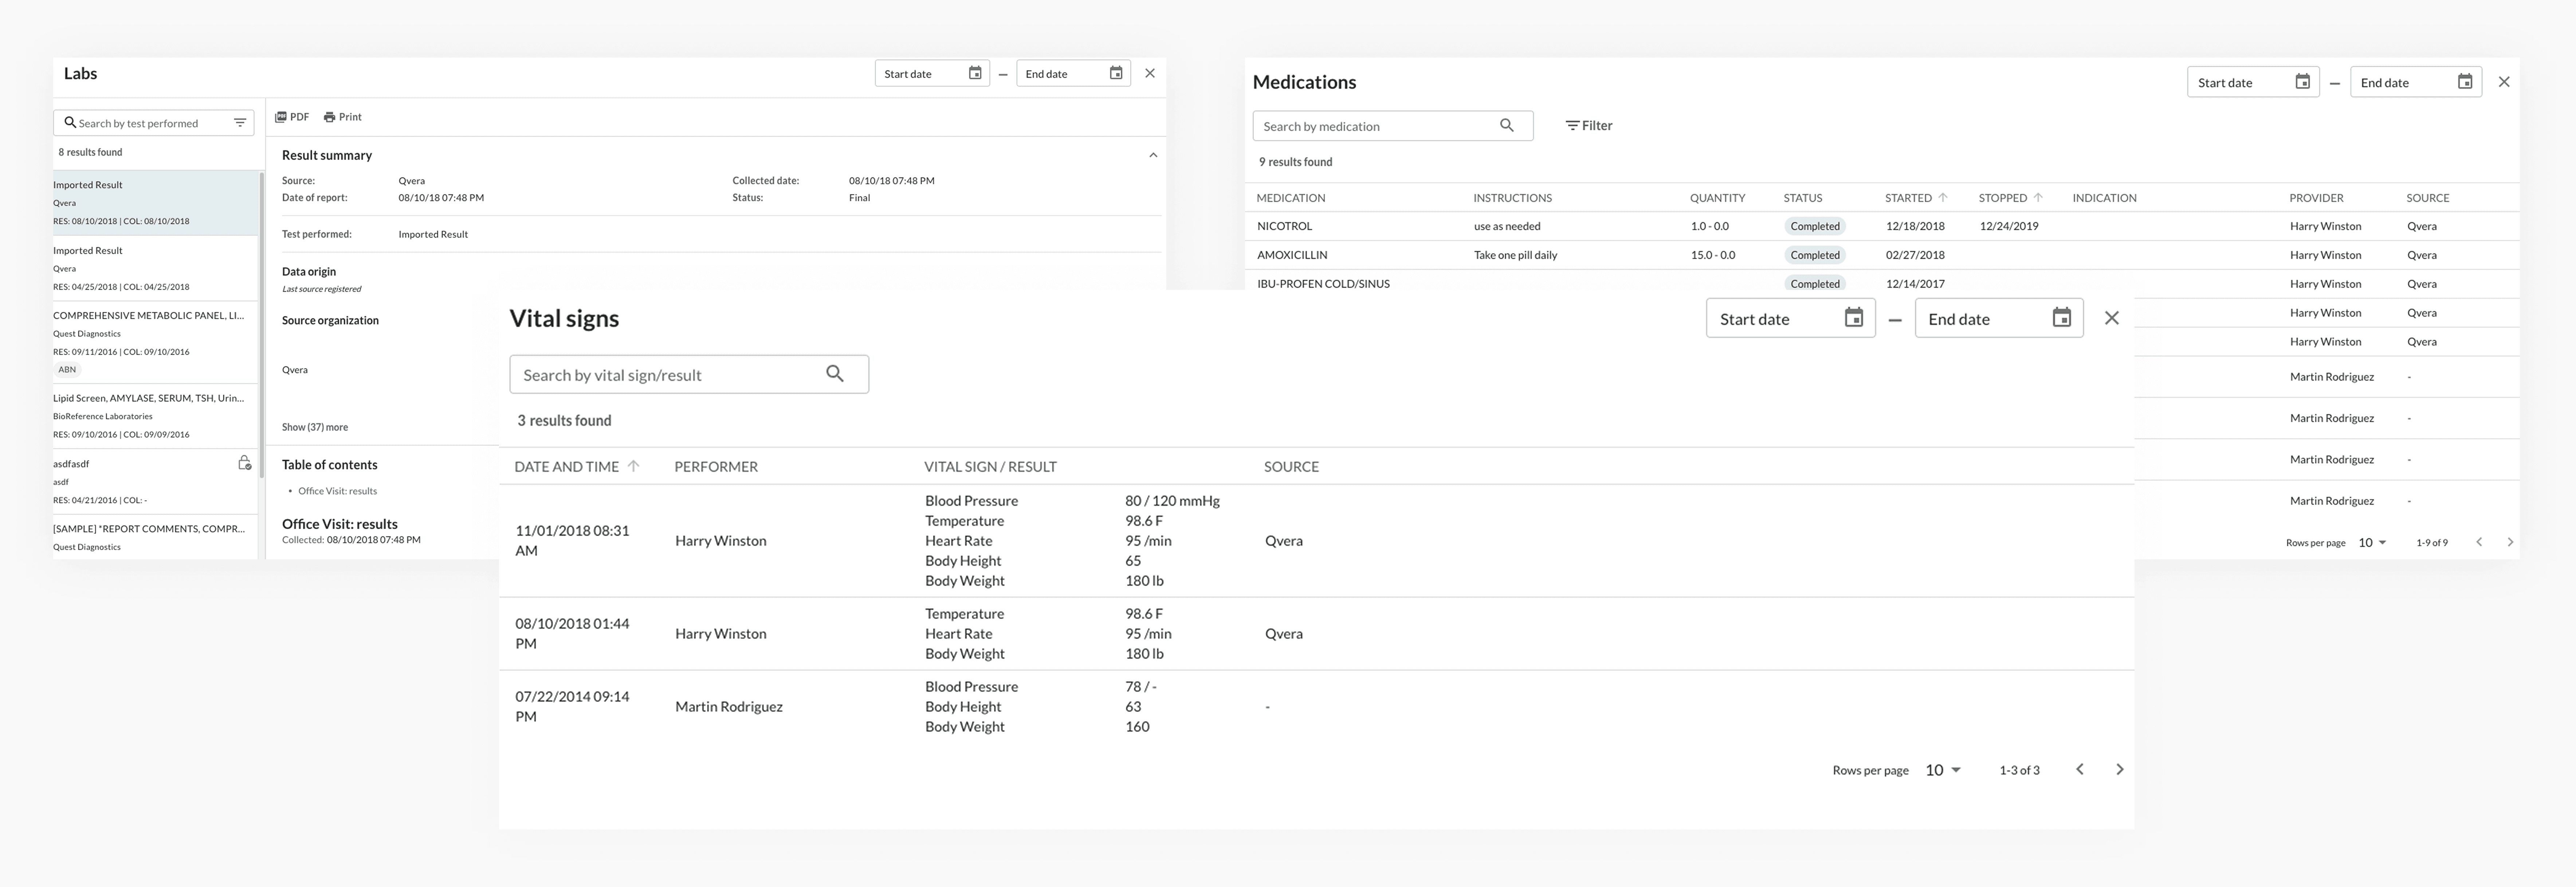
Through UX Research sessions, interviews, and usability testing with healthcare providers and organizations integrated into the healthcare ecosystem, we identified a critical gap in how clinicians interacted with patient data.
While professionals valued having access to comprehensive clinical information, the experience became fragmented and difficult to navigate in high-pressure scenarios, especially during emergency situations or critical diagnoses.
Instead of navigating across multiple modules — each with its own filters and structures — clinicians needed a single, integrated view that allowed them to quickly understand the patient’s context.
One key insight emerged during the research:
Clinicians do not explore information broadly during critical moments — they focus on a specific condition or diagnosis.
For example, during a cardiac event, clinicians need immediate access to all relevant information — including labs, medications, clinical encounters, and vital signs — connected to that diagnosis, without constantly switching contexts.
Approach (Design Thinking)
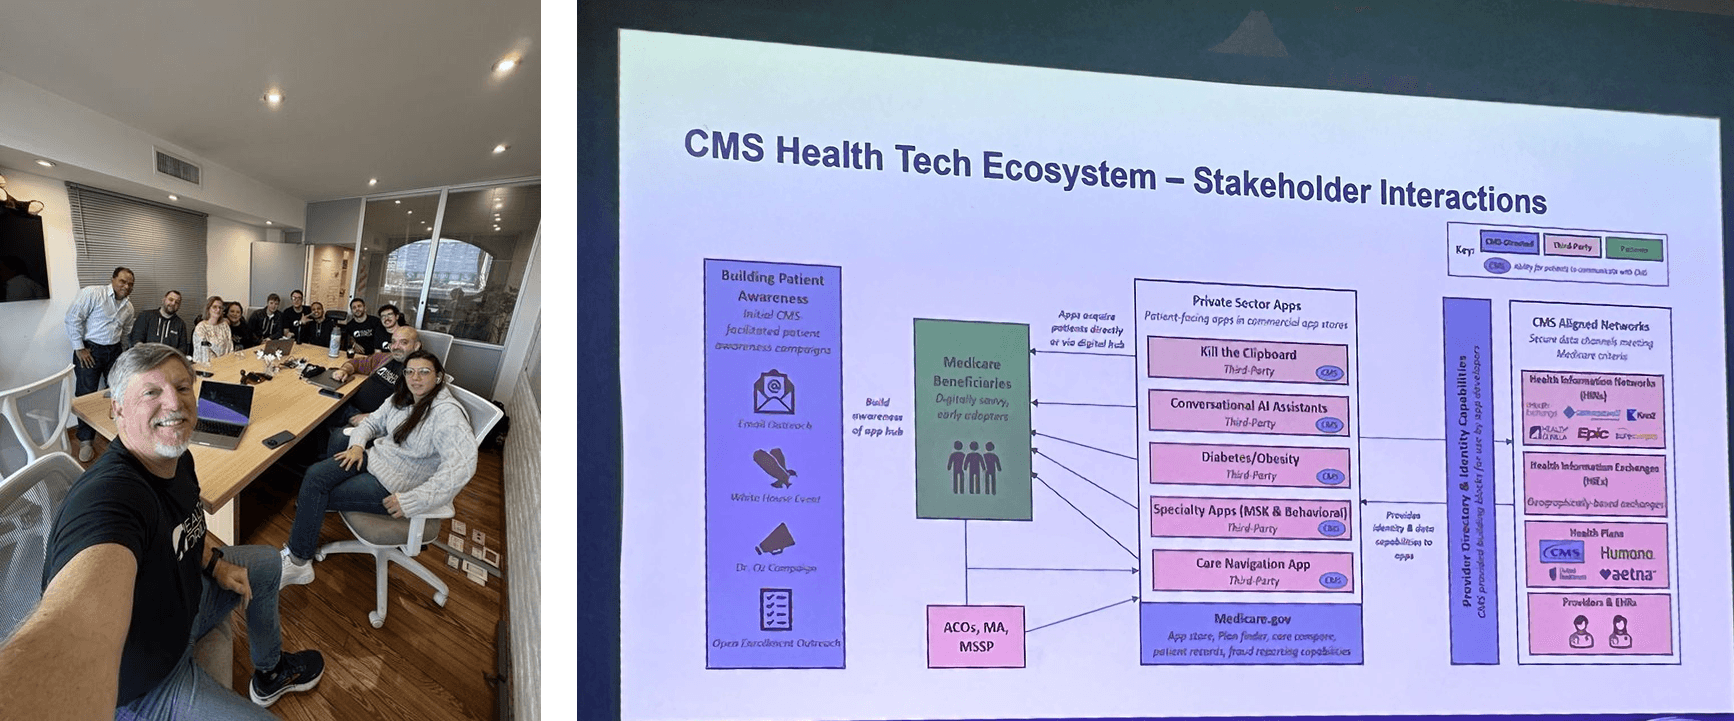
1. UX sessions and stakeholder alignment.
We collaborated with clinical professionals, Product Managers, and business stakeholders to observe real-world workflows, understand user behavior patterns, and identify key pain points across the experience.
2. Journey Mapping and workflow analysis.
We mapped how providers accessed, interpreted, and navigated across multiple clinical data sources to identify friction points, context switching, and opportunities for optimization.
3. Research synthesis and pain point identification.
Based on research analysis and workflow evaluation, we identified the main friction points:
High cognitive load
Fragmented clinical information views
Lack of visual hierarchy and contextual clarity
Complex navigation across modules and filters
4. Rapid prototyping and iteration.
We explored different interaction models through wireframes, prototypes, and iterative user validations to evaluate clarity, efficiency, and usability within critical clinical scenarios.
Designing the experience.
Solution
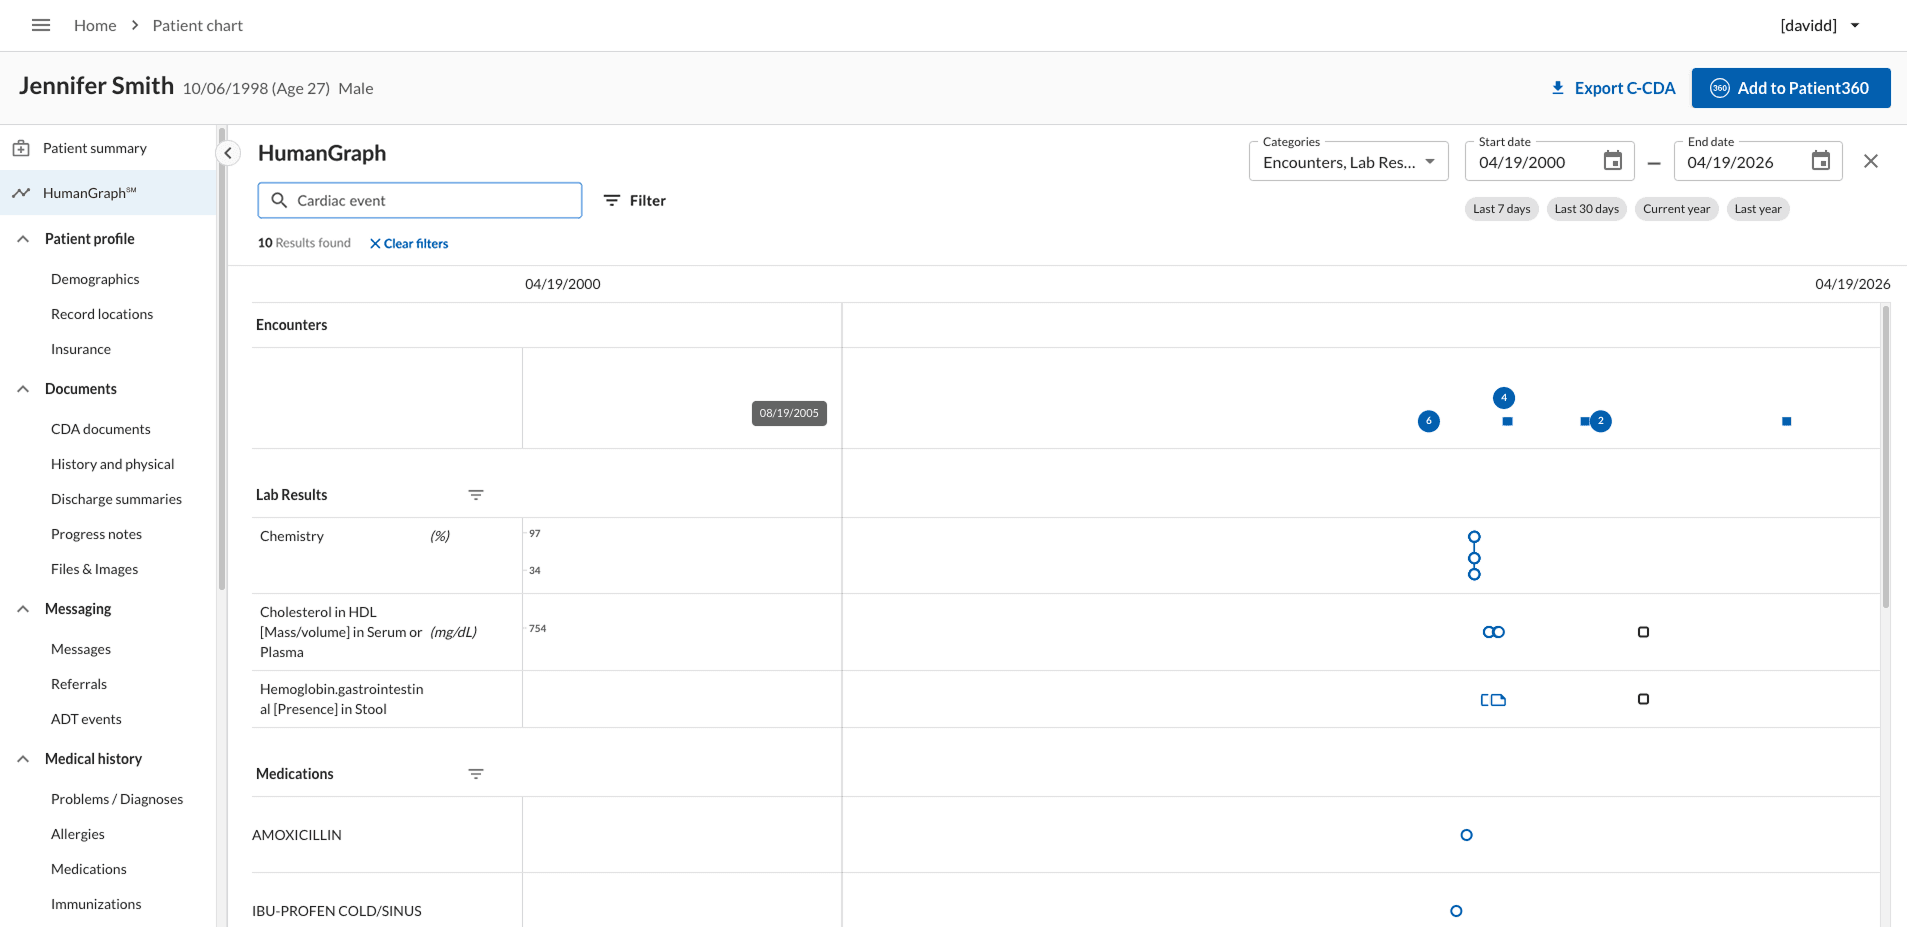
HumanGraph introduce una representación visual y conectada de los datos clínicos del paciente:
Clarity over density → Simplifying complex datasets
Contextual navigation → Grouping related information together
Progressive disclosure → Displaying detailed information only when needed
Systems thinking → Aligning the experience with the design system to ensure scalability
Primera iteración — vista integrada
Second iteration — implementation of contextual filters by:
Physician
Source (Clinic / Laboratory / Hospital)
Diagnosis
Performed study (Laboratory section)
Outcome
Clinicians can now enter the experience with a specific focus and instantly access all relevant information in a single place, enabling faster understanding and more efficient, confident decision-making during critical moments.
Impact
Optimized clinical interpretation → Reduced cognitive load through a more contextual and integrated experience.
High module adoption → Increased engagement and recurring usage by more than 80%.
Ecosystem scalability → Supported large volumes of data and multiple interoperable sources.
